

Mastering AI Automation for Data, Reporting and Decision Support
AI will answer any question about your numbers. First, make sure your numbers mean something.
Ask an AI assistant about your numbers, and you will get a fluent, confident answer, whether or not your company has ever agreed on what those numbers mean. This guide names that problem, the Definition Gap, gives you a three-question check (Meaning, Source, Move), and maps ten places AI automation fits across data, reporting, and decision support: what the evidence says about each, who keeps the decision, and where to start.
What You’ll Find in This Article
- A story about three margin numbers, one confident AI answer, and the meeting that followed
- The Definition Gap and the Fluent Wrong Number, with what two benchmarks and one Harvard Business Review study say about asking AI questions of your data
- The Meaning-Source-Move check: three questions every number must pass before it reaches a decision
- The Four-Question Ladder (describe, diagnose, predict, prescribe) and how it maps to starting levels of autonomy
- Four cases and studies: Zillow Offers, JPMorgan’s spreadsheets, a recruiter experiment on “falling asleep at the wheel,” and a noise audit at an insurer
- Ten places AI automation fits across data, reporting, and decision support, each with the evidence, the check, who decides, and where to start
- Six best practices, six little-known gems, a direct next step, and five FAQs
The AI Assistant Gave a Confident Margin. It was the Wrong Kind of Right
A wholesale distributor connected an AI assistant to its sales and accounting data. In the first meeting, the owner typed a plain question: What was our gross margin on the Henderson account last quarter? The answer arrived in four seconds, in clean sentences, with a number: 31%.
The controller looked at it and said it was wrong. Her report said 27%. The operations manager said his was 34%. Nobody had made an error. The controller subtracted freight and rebates. Operations left both out. The assistant had picked a third way and did not say so, because nobody had ever told it which way was right.
The meeting became an argument about whose number was true. Two weeks earlier, the same leadership team had debated dropping a product line based on a margin figure no one could reproduce. The assistant did not create the confusion. It made the confusion fluent.
So the owner did something unglamorous. She picked the ten numbers that run the company, wrote one sentence defining each, named an owner for each, and pointed the assistant at those definitions first. Margin became ‘gross margin after freight and rebates,’ owned by the controller. The next Henderson answer came back as 27%, with the formula, the source system, and the as-of date attached. It was a smaller project than the one they had planned, and a bigger relief.
The Definition Gap is the distance between how fluently an AI tool can answer a question about your numbers and how clearly your company has agreed what those numbers mean, where they come from, and what you will do when they move. The Fluent Wrong Number is what comes out of that gap: an answer that reads well, sounds sure, and may not be a number your company would stand behind.
Most owners expect AI to fail at math. The more common failure is quieter. The math is fine, and the question was never defined. That is a management problem before it is a technology problem, and it is the part of data, reporting, and decision support that almost nobody writes about
The Definition Gap: What the Research Says
Three pieces of evidence point in the same direction. None is perfect, and each is flagged below. Together they say that the hard part of asking AI about your business is not the AI. It is your data’s meaning, structure, and quality.
Real Enterprise Databases are Much Harder than Demos
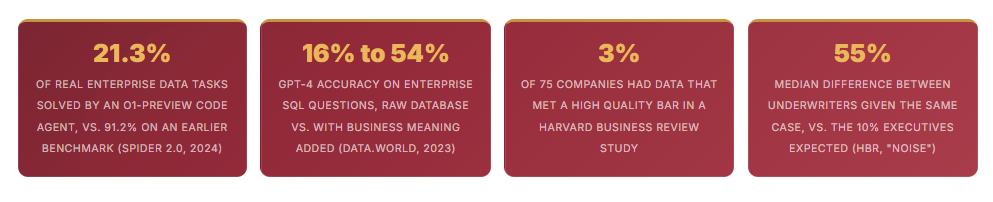
In Spider 2.0, a benchmark presented at ICLR 2025, researchers built 632 real-world tasks from enterprise database workflows. The databases often had more than 1,000 columns and ran on platforms such as BigQuery and Snowflake. A code agent built on OpenAI’s o1-preview solved 21.3% of the tasks. The same kind of system solved 91.2% of Spider 1.0 tasks and 73.0% of BIRD tasks, two earlier benchmarks built on cleaner, smaller databases. Caution: this is a research benchmark on one model generation, and models improve. The lesson is about direction. Tools that look excellent on tidy demo data struggle with the messy structure of real company systems.
Adding business meaning more than tripled accuracy. A 2023 data. world benchmark found GPT-4 answered about 16% of enterprise questions correctly on a raw insurance-domain database, and about 54% when a knowledge graph supplied the business meaning. It used GPT-4, one schema, and was published by a vendor of the approach, so treat the numbers with care.
Most companies’ data fails a simple test. In a 2017 HBR study, managers at 75 companies checked 10 to 15 critical fields on the last 100 units of work their departments completed. Only 3% scored in the acceptable range, and nearly half scored below 57 out of 100. It was self-run, so treat the figures cautiously. The test costs an afternoon, and you can run it yourself.
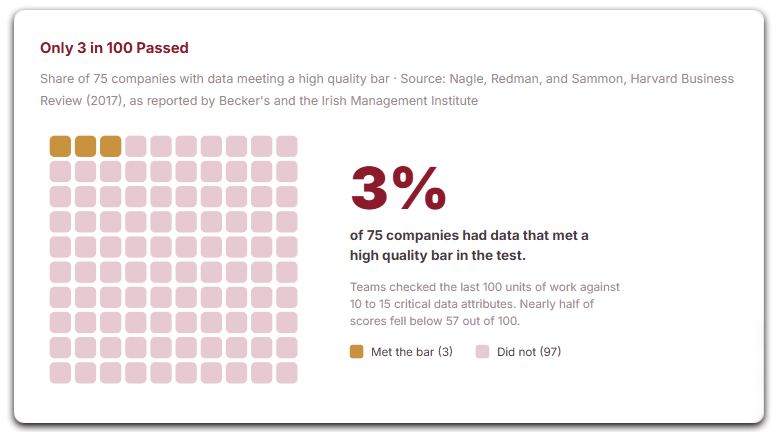
An AI assistant does not know which of your numbers you trust. It answers all of them in the same confident voice.
The Meaning-Source-Move check
Before a number reaches a decision, a company should be able to answer three questions about it. We call this the Meaning-Source-Move check. It is MediaBus Marketing Group’s working method, not an industry standard, and it is built to close the Definition Gap.
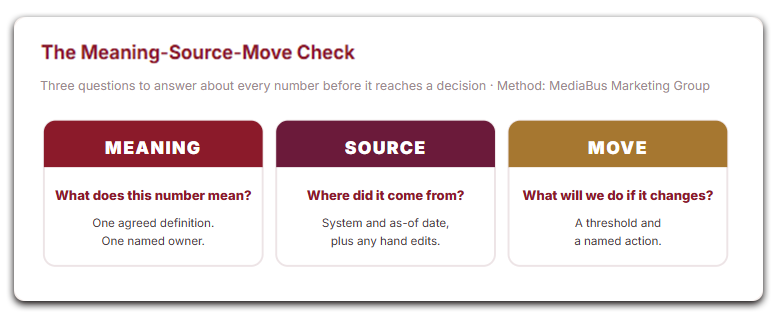
Meaning: what does this number mean, and who owns the definition? “Revenue” can mean invoiced, collected, booked, or recognized. “Active customer” can mean the last 90 days or the last 12 months. Write each key number as one sentence, with its formula and one named owner. If two departments define it differently, the choice belongs to the owner of the business, not the AI tool.
Source: where did it come from, and how fresh is it? Name the system, the as-of date, and anything changed by hand. An answer that can’t be checked will eventually be wrong in front of a customer, a lender, or a board.
Move: what will we do differently if it changes? Attach a threshold and an action to the number, or retire the number. A number with no decision behind it is decoration. This is the question that turns reporting into decision support.
Start with ten numbers. Write down the ten numbers you’d want to see if you could only see ten. Run the check on each. That list becomes the first thing any AI tool is allowed to read.
The Four-Question Ladder: from What Happened to What to Do
A number can answer four different questions, and each is harder and riskier than the last. Describe answers what happened. Diagnose offers possible reasons why. Predict estimates what happens next. Prescribe recommends what to do. Value rises as you climb, and so does the cost of a wrong answer, which is why each step should start with more human control than the one before.
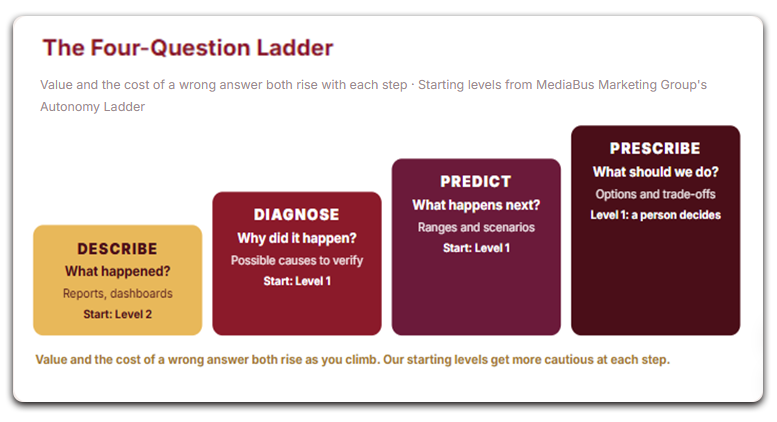
The Autonomy Ladder from our pillar article, Mastering AI Automation for LLM Success, has three levels: Level 1 Assist, where AI drafts and a person decides; Level 2 Workflow, where AI runs a defined routine, and a person reviews exceptions; and Level 3 Agent, where AI acts on its own inside narrow limits. Its rule applies to data as it does to people: treat every automation like a hire, and promote it only after it has earned the next level.
For data and decisions, that rule has a plain translation. Let AI describe at Level 2, once the definitions are settled. Let it diagnose and predict at Level 1, where it offers ideas and ranges that a person tests. Let it prescribe at Level 1 only: it can lay out options and trade-offs, and a person decides. A recommendation that triggers action automatically, with no person in between, is the highest-risk thing on the ladder.
Four Cases & Studies Worth Knowing
Case 1: Zillow Offers and the forecast that became a purchasing machine
In November 2021, Zillow Group announced it would wind down Zillow Offers, its home-buying business. In its third-quarter 2021 results, Zillow reported a write-down of about $304 million on inventory, saying it had bought homes at higher prices than its current estimates of future selling prices. It expected another $240 million to $265 million of losses in the fourth quarter and a workforce reduction of about 25%. CEO Rich Barton said, ‘the unpredictability in forecasting home prices far exceeds what we anticipated.’
This was a machine-learning forecasting system, not a modern chatbot, and the causes were debated. The lesson is structural. A price forecast fed directly into buying decisions at scale, with little room for a person to say ‘this one looks wrong.’ Prediction and prescription were joined into one automated step. That is exactly the step our ladder keeps under human control until a forecast has a long, honest track record.
Case 2: The better the AI, the less the reviewers looked
A working paper titled ‘Falling Asleep at the Wheel,’ commonly attributed to Fabrizio Dell’Acqua of Harvard Business School, ran a field experiment with 181 professional recruiters who reviewed 44 resumes. Recruiters given higher-quality AI recommendations were less accurate than those given lower-quality AI. The recruiters with the weaker AI worked harder, spent more time on each resume, and were less likely to accept the AI’s top pick automatically. The effects were driven by more experienced recruiters. It is one experiment in one field and a working paper, not a final law of nature. Still, it points to a design rule: a good recommendation can make a reviewer stop reviewing.
Case 3: JPMorgan’s spreadsheets
The 2013 JPMorgan Chase Task Force report on the ‘London Whale’ trading losses, which Chase’s own filings put at more than $6 billion, described a risk model that ‘operated through a series of Excel spreadsheets, which had to be completed manually,’ using ‘a process of copying and pasting data from one spreadsheet to another,’ according to excerpts quoted by economist James Kwak. The report also said one spreadsheet ‘divided by their sum instead of their average, as the modeler had intended,’ which ‘likely had the effect of muting volatility by a factor of two and of lowering the VaR.’ We read these through secondary quotations, not the report itself, so check them against the original before you repeat them.
Spreadsheets were not the only cause of the losses, and the report is about much more. The relevant point is smaller and still useful. The old way of reporting was never safe. Manual copy-and-paste is a risk with a long record. Automating report assembly can remove that risk, but only if the formulas and definitions underneath are right. An automated wrong formula is the same error, run faster.
Case 4: A noise audit at an insurer
In a 2016 Harvard Business Review article, Daniel Kahneman and colleagues described a ‘noise audit’ at an insurance company. Underwriters and claims adjusters were given identical cases. Executives expected the professionals’ judgments to differ by around 10%. The median difference between underwriters was 55%, and between claims adjusters it was 43%. Noise means unwanted variation in judgments that should be the same. Its cost is rarely visible because nobody sees the decision the other person would have made.
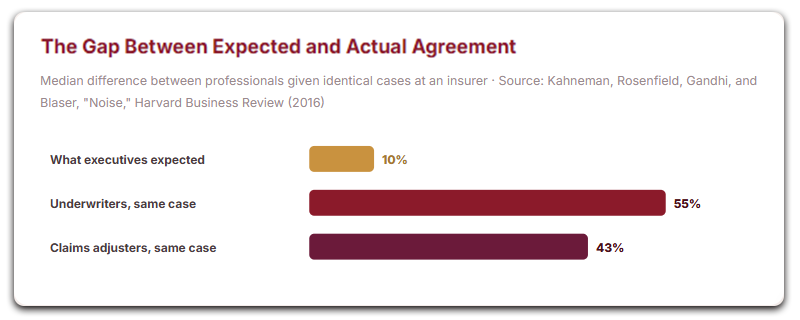
The takeaway for owners is that the best early job for decision support may be consistency, not genius. If two managers looking at the same numbers would decide differently, a well-built brief that lays out the same facts, options, and trade-offs for both can reduce that noise before any forecast is trusted.
And the Payoff is Real When the Work is Done
In a study published in 2011, Erik Brynjolfsson, Lorin Hitt, and Heekyung Kim surveyed 179 large publicly traded firms. They found that firms using data-driven decision making had output and productivity 5% to 6% higher than would be expected from their other inputs and IT investments. It is an association, not proof of cause, and it predates modern AI. It does show what a company is after: not more reports, but decisions that use evidence consistently.

In the Age of AI
You Gain the Advantage over Those Who Don't Step Up
The Ten Place AI Fits Across Data, Reporting & Decisions
Where to start each place
The map groups ten places under three jobs: make your data trustworthy, know what is happening, and decide and learn. They are in that order for a reason. The places on the left feed the places on the right, and skipping them is how a company ends up with a very fast, very fluent wrong number. Each card carries a starting level from MediaBus Marketing Group’s Autonomy Ladder.
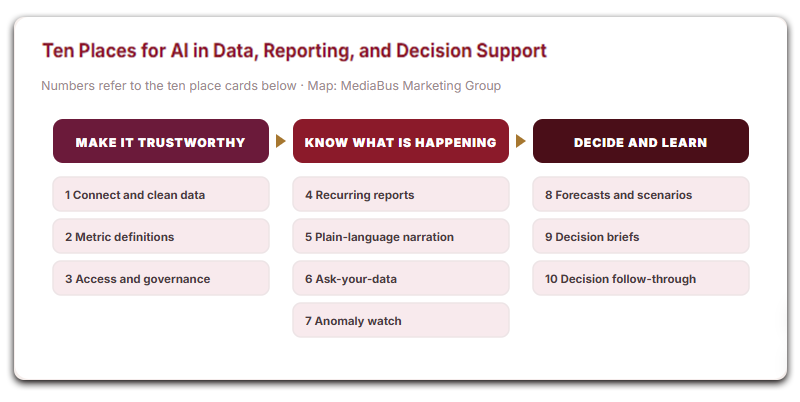
Where to start each place
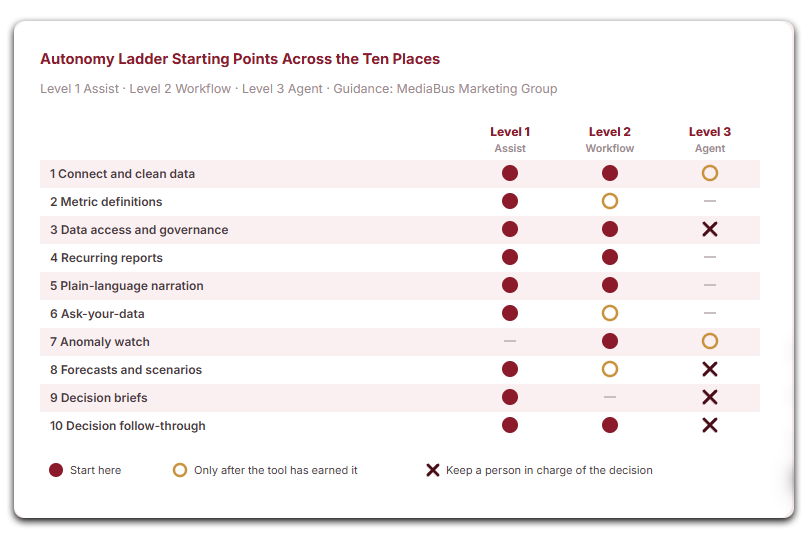
The matrix summarizes the starting level for each place. A filled circle means start there. A ring means the tool should earn that level with a track record first. A cross means a person stays in charge, because a wrong answer costs too much to automate away.
6 Best Practices for AI in Data Reporting & Decisions
Little-Known Gems
The Perspective Shift
AI will answer any question about your numbers. The only question that matters is whether you can stand behind the answer.
A company does not need more data. It needs numbers it can explain, sources it can trace, and a decision attached to each one. When those are in place, AI becomes a mirror that shows you the business as it is, faster than any report ever could. When they are not, it becomes a megaphone for whatever your data happens to say. Decide what a number means before you ask what it says. Learn where it came from before you act on it. Know what you will do when it moves. Do those three things, and the machine works for you.
Bottom Line:
The tools to ask your business questions in plain English are here, and they are fluent. Fluency is not accuracy. A code agent solved 21.3% of real enterprise data tasks in Spider 2.0. GPT-4 answered about 16% of enterprise questions correctly on a raw database and about 54% when meaning was added. Only 3% of 75 companies had data that cleared a high-quality bar. And professionals given identical cases differed by a median 55%, when executives expected 10%.
AI can fix a great deal of this. It can pull the weekly report together, explain what changed, watch the numbers around the clock, build the forecast, and prepare the decision brief
It can only do that well on numbers you have defined, sourced, and attached to a decision.
MediaBus Marketing Group helps business owners and executives define the numbers that run the business, choose which of the ten places to automate first,
Tell us which report or number your team argues about most, and we’ll show you where to start.
📞 · Contact Us Using the Form Below · ✉
Data, Reporting & Decisions FAQs
Q1. What are the major places to use AI automation for data, reporting, and decision support? Ten places in three jobs. Make data trustworthy: connecting and cleaning data, metric definitions, access and governance. Know what is happening: recurring report assembly, plain-language explanations, ask-your-data, anomaly watching. Decide and learn: forecasts and scenarios, decision briefs, decision follow-through. Each starts at its own autonomy level, and a person keeps the decision wherever a wrong answer is costly.
Q2. Can we just ask an AI tool questions about our business data, and how accurate is it? You can, but accuracy depends on how well your data and definitions are set up. Spider 2.0: 21.3% on real enterprise tasks versus 91.2% on an earlier benchmark. data.World 2023: about 16% on a raw database, about 54% with business meaning added. Models keep improving, so test your own: define your top ten numbers, build a 50-question golden set, require formula, source, and date on every answer, and rerun monthly.
Q3. Should AI make decisions for us, or only recommend? For now, only recommend. Zillow’s 2021 wind-down, after a write-down of about $304 million, shows what can happen when a forecast flows straight into buying. A recruiter experiment found people shown higher-quality AI recommendations were less accurate because they reviewed less. Use AI to prepare the decision, have the decider form a view first, and promote automation only after a track record.
Q4. Do we need clean data before we start? Clean enough for the numbers you’ll actually use, not perfect everywhere. Only 3% of 75 companies passed a high-quality bar in the HBR study. Start with the 100-record test on one important process, fix what it turns up, define your top ten numbers, and expand.
Q5. Where should a small business start? Three moves in the same month: write definitions and owners for the ten numbers that run the company, run Meaning-Source-Move on each, and have AI assemble one recurring report at Level 1, in parallel with the old version for two cycles.
Action Items:
Sources Cited in This Article
All sources were read in October 2026. Lei et al., “Spider 2.0: Evaluating Language Models on Real-World Enterprise Text-to-SQL Workflows,” ICLR 2025 (arXiv 2411.07763) · Sequeda, Allemang, and Jacob, “A Benchmark to Understand the Role of Knowledge Graphs on Large Language Model’s Accuracy for Question Answering on Enterprise SQL Databases” (data.world, arXiv 2311.07509, 2023) · Nagle, Redman, and Sammon, “Only 3% of Companies’ Data Meets Basic Quality Standards,” Harvard Business Review (2017), as reported by Becker’s Hospital Review and the Irish Management Institute · Zillow Group, Third Quarter 2021 Financial Results and plan to wind down Zillow Offers (investors.zillowgroup.com; SEC Form 8-K, November 2, 2021) · “Falling Asleep at the Wheel: Human/AI Collaboration in a Field Experiment on HR Recruiters,” working paper (Harvard Business School; summary at Innovation Growth Lab) · JPMorgan Chase Task Force report on 2012 CIO losses (January 2013), as quoted in James Kwak, “The Importance of Excel,” The Baseline Scenario, February 9, 2013, and Henrico Dolfing’s case study on the JPMorgan London Whale · Kahneman, Rosenfield, Gandhi, and Blaser, “Noise: How to Overcome the High, Hidden Cost of Inconsistent Decision Making,” Harvard Business Review (October 2016) · Brynjolfsson, Hitt, and Kim, “Strength in Numbers: How Does Data-Driven Decisionmaking Affect Firm Performance?” (2011) · IBM Cost of a Data Breach Report 2026, as summarized by Baker Donelson (July 30, 2026) and Varonis · The Definition Gap, the Meaning-Source-Move check, the Four-Question Ladder, and the Autonomy Ladder are MediaBus Marketing Group’s own methods. Nothing here is legal, financial, or accounting advice.
SHARE THIS STORY ANYWHERE YOU LIKE
SHARE THIS STORY ANYWHERE

Mastering AI Automation for Data Reporting and Decision Support
Mastering AI Automation for Data, Reporting and Decision Support AI will answer any question about your numbers. First, [...]

Mastering AI Automation for Knowledge and Institutional Memory
Mastering AI Automation for Knowledge and Institutional Memory Don’t hoard your knowledge. Don’t dump it in a tool. [...]

Mastering AI Automation for People and Hiring
Mastering AI Automation for People and Hiring Everyone is automating the front door. The money leaves through the [...]