What Return Should We Expect and How Will We Measure It?

August 10, 2026▪ ▪August 9, 2026▪ ▪Resources & Tools▪ ▪22.2 min▪ ▪
Share This Story, Choose Your Platform!

What Return Should We Expect from AI and How Will We Measure It?

The Complete AI ROI Framework · Benchmarks, Measurement Cadence, and CFO-Ready Proof


What You’ll Find in This Article

  • Why 95% of AI pilots fail to deliver expected returns – and why this is a measurement problem, not a technology problem
  • The 5 categories of AI return every business must account for – including the three most organizations miss entirely
  • The AI ROI formula your CFO will trust – with verified 2026 benchmarks by business function and process type, ranging from 171% to 520%
  • The 5-Step Measurement Framework: baseline establishment, leading vs. lagging indicators, the 90-day review, attribution methodology, and CFO-ready reporting
  • The Time Horizon Reality – what to expect at 30 days, 90 days, 6 months, and 2–4 years
  • The Rework Tax – the hidden metric that explains why most AI productivity gains disappear before they ever reach the P&L
  • Little-Known Gems – five counterintuitive ROI truths that separate elite AI programs from expensive experiments
  • The four measurement mistakes that make AI look like it isn’t working — when it is

The Question Behind the Question

When a business leader asks “What return should we expect from AI?” they are almost never asking about technology. They are asking about trust. Is this real? Will it show up in my numbers? And if it does, will I be able to prove it to my board?

The answers are neither as reassuring as most AI vendors would have you believe nor as discouraging as AI skeptics suggest. Here is the honest picture: $3.50 in verified value is returned for every $1 invested in AI – with top performers achieving $10.30 per dollar (Microsoft-IDC research). But here is the number that should command your full attention: 95% of generative AI pilots fail to deliver their expected returns (Elvex, 2026). This isn’t a technology problem. It’s a measurement problem. Most organizations are using outdated frameworks to evaluate AI investments, focusing solely on cost reduction while missing the broader value creation opportunities.

Only 14% of CFOs can clearly see ROI from their AI investments (IBM, 2026), not because the returns aren’t there, but because 51% of businesses that implement AI cannot measure them (Jasper, 2025). The return you should expect from AI is substantial, documented, and repeatable. The return you will actually realize depends entirely on how well you measure before, during, and after deployment.

THE CORE INSIGHT: Deloitte’s 2026 State of AI research found that 66% of organizations report productivity and efficiency gains from AI, but only 20% are growing revenue through AI – and fewer than a third can measure ROI with confidence. The gap between benchmark performance and typical enterprise performance is not a technology problem. It is a measurement and prioritization problem.


In the Age of AI

You Gain the Advantage over Those Who Don't Step Up

The 5 Categories of AI Return:

The Complete Taxonomy

Most organizations measure one category of AI return and miss four. This is why AI programs get defunded – not because they aren’t working, but because they aren’t measuring everything that’s working. Here is the complete taxonomy of what AI actually returns, and why each category demands its own measurement infrastructure.

Category 1: Hard Cost Savings – The Most Visible Return

400–520% ROI on invoice processing

Hard cost savings are direct, auditable reductions in labor costs, software redundancies, error correction costs, and operational overhead. These are the returns CFOs love because they flow directly to the P&L with a clean audit trail. The 2026 industry benchmarks tell the story: invoice and document processing automation delivers 400–520% ROI. Customer service automation delivers 290–370% ROI. Sales operations automation delivers 340–410% ROI. HR onboarding workflows deliver 250–310% ROI. These numbers are not aspirational – they are the documented output of mature AI programs that measure correctly. Every AI investment conversation should begin here, not because hard savings are the only category that matters, but because they are the category that will open the CFO’s door to everything else.

Category 2: Revenue Growth – The Most Underreported Return

2× revenue vs. laggards by 2028

AI-driven revenue growth comes from three sources: faster conversion (AI lead scoring and nurture convert prospects that previously went cold), higher average transaction value (AI personalization lifts purchase value), and entirely new revenue streams enabled by AI capabilities. Most organizations measure cost savings obsessively while ignoring revenue impact. Yet BCG’s research shows this pattern clearly. Future-ready companies – the top 5% achieving substantial value – expect twice the revenue increase and 40% greater cost reductions than laggards by 2028. The gap widens over time because leaders reinvest early artificial intelligence returns into stronger capabilities, creating a compounding effect.

A sales team of 50 using an AI research and drafting tool, saving 3 hours per week per person at a fully-loaded cost of $75/hour, generates $585,000 in annualized productivity value – before a single additional deal is closed. Revenue impact is not a soft benefit. It is the largest category of AI return – and the one most organizations never capture in their measurement framework. Your comprehensive marketing plan should designate specific revenue targets for each AI-powered initiative before deployment begins.

Category 3: Productivity Recapture – The Most Misunderstood Return

6.4 Hrs/Week per Knowledge Worker

Productivity recapture is the recovery of human time from repetitive, automatable work. AI saves an average of 6.4 hours per knowledge worker per week (McKinsey, 2026). But here is the critical insight most organizations miss: time saved is not value created until it is redirected to something more valuable. Companies are reporting an average 11.5% increase in net productivity over the past 12 months when AI deployment is measured properly – but 91% use AI while 95% see no bottom-line impact. The gap between time saved and value created is the productivity paradox of 2026. The measurement discipline required: track not just time saved by AI, but what that time was redirected to.

Category 4: Risk Reduction – The Invisible Return

The Invisible but Massive Return

Risk reduction is the most undervalued category of AI return because it measures what didn’t happen. AI fraud detection prevents losses that never appear in the accounting system because the fraud was stopped before it occurred. AI compliance monitoring prevents regulatory penalties before they’re assessed. AI quality control prevents defective products from reaching customers, eliminating recall costs, warranty claims, and reputational damage. JPMorgan has deployed more than 450 active AI use cases in production, with fraud detection and trade settlement among the highest-volume applications. In financial services, these systems’ ROI is measured in prevented losses – returns that never appear in a traditional revenue analysis but which can dwarf the cost of any AI investment.

Category 5: RStrategic Positioning – The Compounding Return

2.5x More Likely to Have Governance in Place – BCG

Strategic positioning captures the competitive advantage that accumulates as your AI systems learn, improve, and create capabilities your competitors cannot rapidly replicate. BCG’s research documents that future-ready companies (the top 5% achieving substantial AI value) are 2.5× more likely to have governance and value-measuring setups in place. The AI Flywheel effect means early movers build a compounding advantage: the AI that has processed two years of your customer data is better at serving your customers than any AI a competitor deploys from scratch today, regardless of platform. This return begins accruing the moment you deploy – and is measurable in competitive win rate, customer retention, and market share. Pair strategic AI deployment with an AI visibility audit to measure how your positioning is landing across both traditional search and the AI citation ecosystem where buyers are increasingly making decisions.

The AI ROI Formula Your CFO Will Trust
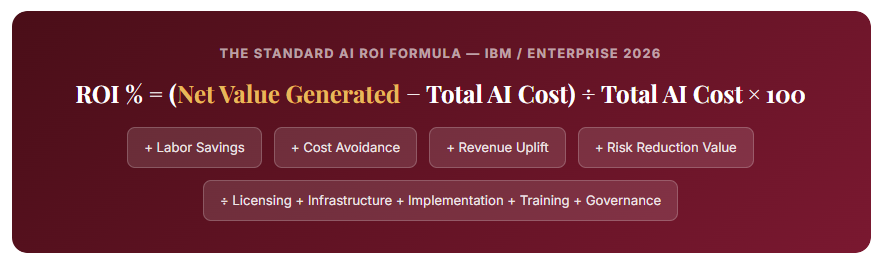
Where:

  • Net Value Generated = labor savings + cost avoidance + revenue uplift + risk reduction value
  • Total AI Cost (TCO) = licensing + infrastructure + implementation + training + governance + ongoing support

What makes this formula break in practice: organizations that count only licensing costs in the denominator while also undercounting revenue uplift in the numerator. Full Total Cost of Ownership accounting (including implementation time, change management, training, and governance infrastructure) is the only way to produce a number that survives CFO scrutiny. The benchmarks that give this formula meaning
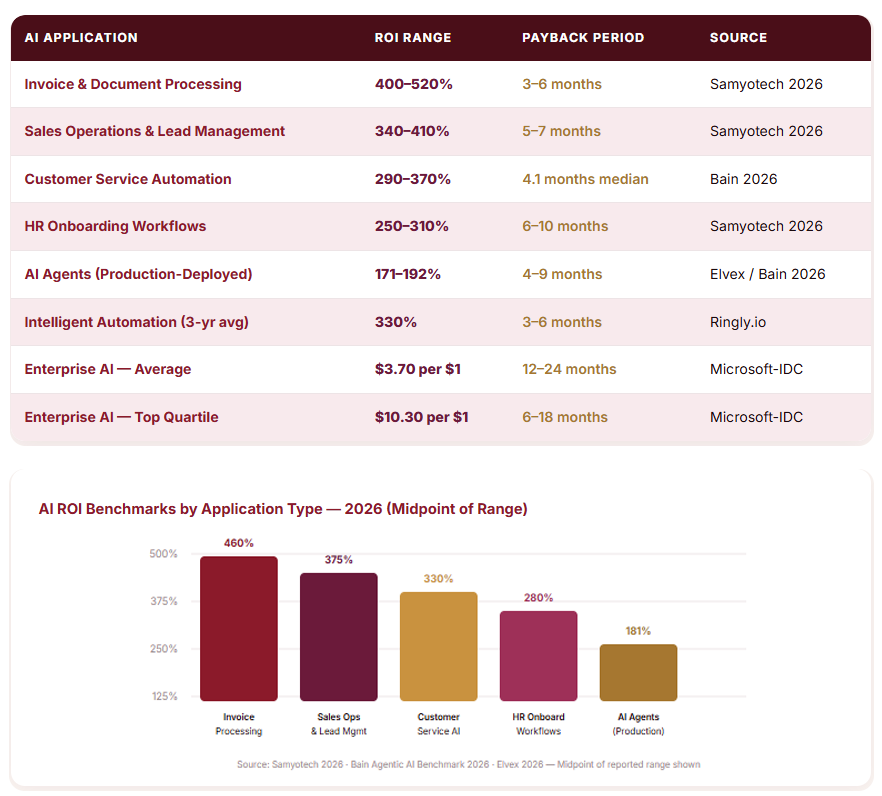
The 5-Step Measurement Framework: How to Prove AI ROI to Your CFO

70% of business leaders state that clear KPIs are vital for sustained AI success (MIT Sloan). The organizations that build measurement infrastructure before deployment consistently outperform those that instrument after the fact – by factors of 3–5× on the same technology investments.

Step 1: Establish the Baseline

Before You Flip the Switch

The baseline is the most critical step in AI ROI measurement – and the one most organizations skip. You cannot prove improvement against a starting point you never documented. Before deploying any AI system, measure and record: time spent on the target task per person per week; error rates or quality failure rates; cost per transaction or output; customer satisfaction scores; and conversion or close rates. Most organizations start measuring ROI after deployment. The NIST AI Risk Management Framework is explicit: Without a documented pre-deployment baseline, post-deployment improvements are unverifiable – you’re comparing a number to a guess. The practitioner standard: 30 days of pre-deployment data collection across all target metrics. This is not optional maintenance – it is the entire foundation of a defensible ROI case. Paired with MMG’s AI Visibility Audit framework, this baseline work gives you a complete operational and competitive starting point before AI changes the picture

Step 2: Define Leading vs. Lagging Indicators

Pair Them From Day One

Leading indicators appear within days or weeks of deployment. They tell you whether the AI is functioning and being adopted.  Track in the first 30–60 days: task completion rate, automation rate, average handle time, AI tool adoption rate, and employee proficiency scores. Lagging indicators appear after months of operation. They tell you whether the AI is creating financial value. The discipline is to pair them: steer month-to-month by leading indicators, and validate with lagging indicators that the leading signals told the truth. Track only lagging indicators, and you drive by the rear-view mirror; track only leading ones and you mistake activity for value.

AI tool adoption rate, average handle time reduction, automation rate, and employee proficiency scores. Lagging indicators to track at 6–12 months: cost savings realized vs. baseline, revenue attributable to AI, customer satisfaction score delta, conversion rate change, and error rate reduction. This paired framework is what 85% of AI ROI leaders use according to Deloitte’s 2025 research – and it is what separates programs that earn sustained investment from those that get cut at the first budget cycle.

Step 3: The 90-Day Review

The Most Important Meeting in Your AI Program

Set a formal 90-day review before deployment begins. Put it on the calendar before you turn anything on. Bring your leading and lagging indicators into the same room with the stakeholders who approved the investment. If the 90-day data shows that a key assumption significantly missed its target, investigate the cause before the 12-month review. A missed assumption at 90 days is recoverable. A missed assumption discovered at the 12-month review, when the board is asking for the annual results, is not.

At the 90-day mark: compare actual performance against the pre-deployment baseline; identify which assumptions held and which didn’t; update the financial model with real numbers; and course-correct before the annual review. This meeting is not a formality. It is the inflection point at which most AI programs either secure their next phase of investment or begin the slow death of organizational skepticism that no technology can survive.

Step 4: Attribution Methodology 

Isolate the AI Signal

Attribution is the hardest problem in AI ROI measurement because AI rarely operates in isolation. A customer service AI is deployed alongside a new agent training program and a CRM upgrade in the same quarter. Which improvement came from the AI? Three attribution approaches that survive CFO scrutiny: (1) Parallel comparison– run AI-assisted workflows alongside non-assisted workflows simultaneously and measure the delta; (2) Statistical regression – control for confounding variables where parallel testing isn’t possible; (3) Controlled rollout – deploy AI to one team or region while maintaining a control group in identical conditions. The teams that get the clearest AI ROI picture are the ones that built their measurement framework before they flipped the switch — not after. An integrated comprehensive marketing plan that accounts for AI attribution from the outset creates the cleanest measurement environment possible.

Step 5: CFO-Ready Reporting 

The Language of Financial Proof

AI ROI reports fail to earn CFO confidence when they measure inputs (efficiency metrics, productivity scores) instead of outputs (revenue, margin, cost reduction). Finance chiefs need outcome-based metrics that tie AI investments to the P&L. Otherwise, you’re just tracking activity, not results. The format that works: pre-deployment baseline metric → post-deployment metric → delta in dollar terms → cost of producing that delta → net return.

In plain language: “We invested $X. We recovered $Y in measurable cost savings, $Z in attributable revenue, and $W in risk reduction value. Our net return over 12 months is [ROI%].” Any AI program that cannot express itself in this format will lose budget at the next cycle – regardless of how well it actually performed.

The Time Horizon Reality

What to Expect and When

The primary reason AI programs lose organizational confidence is mismatched expectations about when returns appear. Setting the correct timeline is not pessimism – it is the condition for maintaining the organizational patience required to let compounding returns develop.

Days 1–30: Technology functioning, users adopting, baseline metrics moving. Leading indicators visible. No financial returns expected or required.

Days 30–90: Efficiency gains measurable. Time savings documented. First hard cost reductions appearing. Lagging indicators beginning to move. This is the window your 90-day review was designed to capture.

Months 3–6: ROI positive for well-scoped customer service and sales automation implementations. Research compiled by Ringly.io shows that intelligent automation investments produce an average 330% return over three years, with most businesses seeing payback within 3 to 6 months for well-scoped initiatives.

Months 6–12: Revenue impact measurable for mature sales and marketing AI programs. Finance and operations automation at positive ROI. Top performers at $3.70–$10.30 per dollar invested.

Years 2–4: Full strategic positioning return realized. AI systems improved by 12–24 months of operational data. BCG’s research shows future-ready companies at 2× revenue increase and 40% greater cost reductions vs. laggards. Deloitte research shows most organizations achieve satisfactory ROI within 2–4 years.

The honest practitioner benchmark: if a tool cannot save 3–5 hours per user per week in a specific workflow, it will not pay for itself. This is not a ceiling – it is a floor. Start with use cases that clear this threshold before expanding to more complex deployments.

The Measurement Mistakes That Make AI Look Like It Isn’t Working

These four patterns explain why 95% of AI pilots disappoint – not because the technology failed, but because the measurement did.

Mistake 1: No Baseline – No Verifiable Improvement. Organizations start measuring ROI after deployment. Without a documented pre-deployment baseline, post-deployment improvements are unverifiable – you’re comparing a number to a guess. The NIST AI Risk Management Framework is explicit: baselines are required for verifiable improvement. Spend 30 days documenting current performance before any AI goes live. This is the single highest-leverage investment you can make in your AI program before it starts.

Mistake 2: Measuring Inputs Instead of Outputs. “Our AI processed 12,000 documents last month” is an input metric. “Our AI processing reduced document handling costs by $140,000 and eliminated 3 FTE-equivalent hours of daily manual review” is an output metric. Executives are being asked to double AI spending while simultaneously making cost optimization their top priority. Metrics matter. If you’re measuring inputs instead of outputs, you’ll never connect AI spend to business value. Boards make budget decisions based on output metrics – revenue, margin, cost reduction. Organizations that measure only activity lose budget at the next cycle, regardless of how well their AI actually performed.

Mistake 3: The Productivity Paradox – Time Saved, Value Uncaptured. 91% of organizations report using AI, but 95% see no bottom-line impact. The primary reason is the productivity paradox: AI saves time, but organizations fail to convert saved time into financial value. 32% of organizations respond to AI-generated time savings by simply increasing workload – leaving employees to navigate AI on their own instead of using the time AI saves to build skills or higher-value outputs. Track what the recovered time is redirected to. If the answer is “more of the same work,” the productivity gain is real, but the financial ROI is zero.

Mistake 4: Ignoring Full Total Cost of Ownership. Most AI ROI calculations undercount total cost. Full TCO includes: licensing and subscription fees, implementation and integration labor (often 2–3× the licensing cost), change management and training investment, ongoing governance infrastructure, and the hidden “Rework Tax” – the time employees spend reviewing, correcting, and managing AI outputs. Organizations that use licensing cost alone as their investment denominator consistently produce ROI numbers that collapse under CFO scrutiny and lose organizational confidence at exactly the moment they need it most.

Little-Known Gems:

What Elite AI Programs Measure That Others Don’t

These are the measurement insights that separate the 5% achieving substantial AI value from the 95% still in pilot mode.

Gem 1: The Rework Tax 

Your Hidden ROI Killer.

In organizations without proper AI governance and output quality controls, approximately 40% of the time “saved” by AI is spent reviewing, correcting, and managing AI outputs. This means a tool that saves 5 hours per week actually delivers only 3 hours of net time value – and if that rework is being done by a higher-paid employee reviewing a lower-paid employee’s AI output, the economics invert entirely. Measure your rework tax before and after deployment. Organizations that build quality-control checkpoints into their AI workflows consistently achieve 30–50% higher measured productivity gains than those that deploy without governance structures.

Gem 2: The AI Literacy Premium 

Your Multiplier.

Microsoft-IDC research shows that the average ROI on AI training is $3.70 per dollar invested – but top-performing organizations achieve a $10.30 return per dollar. The difference isn’t which AI platform they use. It’s how well their people are trained to use it. AI fluency is the most underinvested multiplier in enterprise AI programs. Measure employee proficiency scores as a leading indicator – they predict financial performance 3–6 months before financial metrics move. A business that invests in structured AI training alongside deployment consistently outperforms one that deploys without training investment, even using identical technology.

Gem 3: GEO Return

The AI ROI Category Nobody Is Measuring Yet.

Generative Engine Optimization (GEO) return is the newest and most overlooked category of AI-driven ROI. As AI systems like ChatGPT, Perplexity, and Google AI Overviews become primary research tools for business buyers, the return from being cited in AI-generated answers is real, measurable, and currently uncontested by most competitors. Organizations measuring their AI citation visibility – tracking mention rate, citation rate, and share of voice in AI search results – are building a channel that grows in value as AI search adoption accelerates. An AI visibility audit is the starting point for measuring this return. Understanding which AI crawlers are indexing your content in 2026 directly determines your baseline in this emerging measurement category. Your online content strategy feeds both channels simultaneously – and the ROI it generates across both should be measured, not guessed at.

Gem 4: The 30-Day Baseline Window

Specificity Matters.

Most measurement frameworks recommend establishing a pre-deployment baseline without specifying how long that window should be. The practitioner standard: 30 days of pre-deployment data collection across all target metrics. Shorter windows introduce seasonal or random variation that inflates or deflates measured improvement. 60-day windows are better for volatile metrics like sales conversion rates. Organizations that anchor their AI ROI calculations on a single day or week of “before” data consistently produce results that do not withstand audit – and lose CFO confidence at exactly the moment that confidence is most needed.

Gem 5: Compound Attribution

Why Your AI ROI Is Probably Understated.

Most AI ROI frameworks measure individual use cases in isolation. The highest-performing AI programs discover that benefits compound across functions: a customer service AI reduces call volume → which frees agent time → which allows agents to handle more complex queries → which improves customer retention → which increases lifetime value → which increases revenue.

This cascade began with a single AI-assisted interaction. Research compiled by Ringly.io shows that intelligent automation investments produce an average 330% return over three years. The compounding is the point. Measuring only the immediate, direct benefit of a single AI deployment consistently understates the true return of a well-integrated AI program by 40–60%. Explore the full MMG AI strategy and article library to understand how these compounding effects map across marketing, content, SEO, and AI visibility simultaneously.

Bottom Line: Build the Ledger Before You Load the Ships

The AI ROI story: The returns are real: $3.50 to $10.30 per dollar. 290–520% on specific high-frequency process automation. 11.5% net productivity gain when deployment is measured correctly. 2× revenue growth for “future-ready” companies by 2028. These numbers are not fabricated – they are the documented output of organizations that built their ledger before they loaded their ships.

The organizations that fail – the 95% whose AI pilots don’t deliver expected returns – do not fail because AI doesn’t work.

They fail because they never defined what “working” would look like in numbers.

They never established the baseline. They never built the measurement infrastructure. They never asked: what leading indicator will tell me, in 30 days, whether this is on track? And so when they go to the board, they have feelings, but not figures.

Here is what we know about you: You are reading this because you are serious about your AI investment. Not just about deploying it – but about proving it. You understand that the right question is not “Does AI work?” but “Does it work for us, in this use case, at this cost, measured against this baseline, within this timeframe?” You want the system that compounds. And you want the ledger that proves it.

MediaBus Marketing Group has spent over 25 years building marketing and technology systems for businesses that demand proof, not promises. We start with measurement. We build baselines. We define leading and lagging indicators before the first workflow goes live. And when the 90-day review arrives, we come prepared with numbers – not narratives.

📞 Contact Us at MMG Today 🌐 

Your AI ROI framework starts with a single conversation – and that conversation is worth more than every unmeasured AI tool you’ve ever deployed. Build the ledger. Load the ships. Prove the return.


Measure AI ROI – FAQs

Q1: What ROI should I realistically expect from my AI investment?

The honest benchmark: $3.50 in verified value returned per $1 invested in AI, with top-performing organizations achieving $10.30 per dollar (Microsoft-IDC). For specific high-frequency process automation: invoice and document processing delivers 400–520% ROI; customer service automation delivers 290–370%; sales operations automation delivers 340–410%; HR onboarding workflows deliver 250–310%. However, most organizations achieve satisfactory ROI within 2–4 years, not within the first 12 months (Deloitte). Only 6% of even the most successful AI projects report payback in under a year. The honest expectation: strong ROI is achievable and documented – but it requires proper measurement infrastructure, formal review cadences, and organizational patience. Organizations without measurement frameworks see the same results as those with them. They just can’t prove them – and unprovable results don’t get refunded or reinvested.

Q2: How do I measure AI ROI when it’s hard to isolate AI’s contribution?

Attribution is the hardest problem in AI ROI measurement. Three approaches work in practice: (1) Parallel comparison – run AI-assisted workflows alongside non-assisted workflows simultaneously and measure the delta. This is the cleanest attribution method and should be used wherever operationally possible. (2) Statistical regression – where parallel testing is not possible, control for confounding variables (seasonal trends, team changes, other technology deployments) using regression analysis. (3) Controlled rollout – deploy AI to one team, department, or region while maintaining a control group in identical conditions. The organizations producing CFO-grade attribution reports designed for attribution before deployment. If you are trying to attribute AI’s contribution after deployment, without a pre-deployment baseline and without a parallel comparison design, you are working with estimates – and estimates lose to skepticism in boardrooms every time.

Q3: What are the most important KPIs for measuring AI ROI?

Use a paired framework of leading and lagging indicators. Leading indicators – measurable in 30–60 days: task completion rate, AI tool adoption rate, average handle time reduction, automation rate, and employee proficiency scores. These tell you whether the AI is functioning and being used. They are your 90-day steering wheel. Lagging indicators – measurable at 6–12 months: cost savings realized vs. baseline, revenue attributable to AI, customer satisfaction score delta, conversion rate change, and error rate reduction. These tell you whether the AI is creating financial value. Track only leading indicators and you mistake activity for value. Track only lagging indicators, and you can’t steer until it’s too late. Pair them from day one, validate them at 90 days, and report them against the pre-deployment baseline at every board review.

Q4: How long should I wait before evaluating AI ROI?

Set a formal 90-day review before deployment begins – put it on the calendar before you turn anything on. This is your first meaningful evaluation checkpoint: leading indicators will have stabilized, and initial lagging indicators will be visible. At 90 days, compare actuals against pre-deployment baselines, update your financial model with real numbers, and identify any assumptions that missed their targets. A second formal review at 6 months captures the first meaningful lagging indicator data. A 12-month annual review provides the first full-year P&L picture. The practitioner threshold: if a specific AI tool cannot demonstrably save 3–5 hours per user per week in its target workflow within 90 days, it will not pay for itself at typical licensing costs. That is your 90-day decision signal — not a final verdict, but the signal to investigate before committing additional investment.

Q5: What is the single most common reason AI ROI measurements fail?

No baseline. Organizations start measuring ROI after deployment, which means post-deployment improvements are compared to a guess rather than a documented starting point. Without a pre-deployment baseline across every target metric, you cannot prove that AI caused any improvement – you can only assert it. CFOs and boards do not fund assertions. The single most valuable thing you can do before any AI deployment is spend 30 days documenting current performance: time per task, error rates, cost per output, conversion rates, and customer satisfaction scores. This 30-day investment in baseline measurement is the difference between a compelling ROI case at the 12-month review and a defensive conversation about why the numbers are unclear. The ledger must be opened before the ships leave port.

Action Items:

  • Determine Your Focus & Commitment

  • Give Us at MediaBus Marketing a Call

  • Begin Getting Your Local in Shape with Us

SHARE THIS STORY ANYWHERE YOU LIKE

SHARE THIS STORY ANYWHERE

LATEST NEWS

LATEST NEWS

Go to Top