

What AI KPIs Should I Actually Track?
The 6-Metric Framework That Separates Proof from Guesswork
What You’ll Find in This Article
- A business case study – how a professional services firm discovered they’d been measuring the wrong things entirely
- Why 56% of CEOs report zero AI ROI – and why the disconnect is a measurement problem, not an AI problem
- The vanity metrics costing you credibility: license counts, logins, and prompts sent versus what actually matters
- The 6-metric operations framework that converts AI programs from cost centers into documented advantages
- The 4 ROI pillars every AI initiative should be measured against – efficiency, revenue, risk, and innovation
- What to track in the first 90 days versus what to track after that
- Little-Known Gems – five measurement truths most AI vendors and consultants never mention
The Dashboard That Looked Great and Meant Nothing
A mid-size professional services firm had rolled out an AI assistant across its team eight months earlier. At the quarterly leadership review, the operations director proudly presented the dashboard: 87% of employees had logged in at least once. 4,200 prompts had been sent that quarter. License utilization was at 91%. By every number on the screen, the rollout looked like a success story.
Then the CFO asked one question the dashboard didn’t answer: “What did we actually get for the $60,000 we’re spending on this?” Nobody in the room could say. Not because the AI wasn’t working, but because nobody had ever defined what “working” would look like in terms tied to the business, only in terms tied to the platform.
Over the following quarter, the firm rebuilt its measurement approach from scratch. They stopped reporting login counts and prompt volume. They started tracking four specific things: the average time to draft a first-round client proposal (down from 3.2 hours to 51 minutes), the percentage of AI-drafted documents requiring major partner revision (down from 61% to 24% after two months of prompt refinement), the number of new client engagements the freed-up partner hours enabled per quarter, and the dollar value of billable hours redirected from drafting to client-facing work.
The new dashboard was smaller – four numbers instead of eleven – and it was the first one that actually answered the CFO’s question. The AI hadn’t changed. The measurement had.
(This is an illustrative composite based on documented enterprise AI measurement patterns and verified industry benchmarks – PwC 2026, MIT Project NANDA, McKinsey QuantumBlack — reflecting the typical range reported for comparable professional-services AI measurement transitions, not a single named client engagement.)
This scene plays out in leadership meetings across the country every quarter. The AI is working. The dashboard is full of numbers. And nobody can answer the one question that actually matters: what did the business get for the money? The gap between those two realities is almost never a technology gap. It’s a measurement gap, and it’s the single most fixable problem in AI strategy today.
The Measurement Gap: Why “It Feels Like It’s Working” Isn’t Good Enough
56% of CEOs report zero financial return from AI, according to PwC’s 2026 Global CEO Survey of 4,454 executives across 95 countries. This has moved AI ROI accountability from a background concern to an active board agenda item. Meanwhile, MIT’s Project NANDA research, based on 150 leader interviews, a survey of 350 employees, and analysis of 300 public AI deployments, found that 95% of enterprise generative AI pilots deliver zero measurable P&L impact.
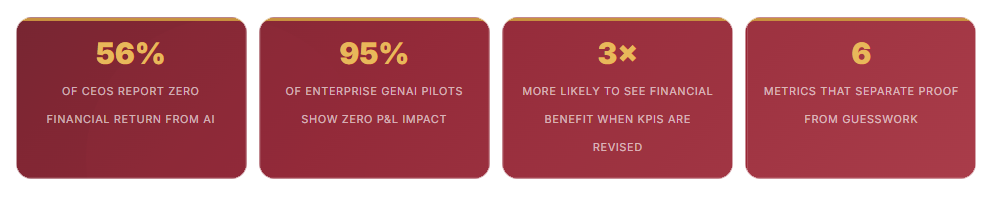
Here is the detail that matters most: a separate Wharton School study found that among the minority of businesses that actually measure their generative AI ROI, 74% report a positive return. Put those two findings together and a clear pattern emerges; the businesses seeing results are disproportionately the ones who bothered to measure in the first place. That gap between “the businesses that measure it see results” and “most organizations can’t show it at all” is a measurement paradox, not a technology paradox.
The data is unambiguous on the fix: companies that revise their KPIs with AI are three times more likely to see greater financial benefit than those that do not (BCG Henderson Institute / MIT Sloan Management Review). Most enterprises measure AI adoption by counting licenses or logins. Neither metric tells a board whether AI is delivering business value. Operations leaders who cannot produce specific, attributed business outcome metrics from their AI programs are now defending their budgets rather than expanding them — which makes the choice of what to measure one of the highest-stakes decisions in any AI initiative.
THE CORE DISTINCTION: The AI KPIs that matter track process outcomes, not platform activity. Adoption rate and login counts tell you whether people opened the tool. Cycle time reduction, error rate, and business outcome metrics tell you whether opening the tool changed anything that matters to your P&L. Measurement infrastructure is not optional groundwork — it is the ROI infrastructure itself.
Key statistics:
- 56% of CEOs report zero financial return from AI — PwC 2026 Global CEO Survey
- 3× more likely to see financial benefit when KPIs are revised alongside AI adoption — BCG/MIT
- 95% of enterprise GenAI pilots deliver zero measurable P&L impact — MIT Project NANDA
- 15-30% efficiency gains within six months when operations are actively measured and tracked — McKinsey

In the Age of AI
You Gain the Advantage over Those Who Don't Step Up
Vanity Metrics vs. Metrics That Actually Prove Value
Most organizations struggle with AI measurement for the same four reasons: they measure outputs, not outcomes; they set no baseline before rollout, making before/after comparisons impossible; they rely on self-reported data rather than system-level telemetry; and they apply a one-size-fits-all approach across teams with genuinely different use cases. Here is what that looks like in practice – and what to track instead:
The 6-Metric Operations Framework
The AI KPIs that matter track process outcomes, not platform activity, across six dimensions. This is the framework that converts AI programs from cost centers that organizations have to defend into documented operational advantages they can expand with confidence.
The 4 ROI Pillars Every AI Initiative Should Map To
Beyond the six operational metrics, leaders should think in four ROI pillars when framing AI’s value to the broader business; this is the language a board actually speaks:
Little-Known Gems: What Most AI Measurement Guides Won’t Tell You
Gem 1: Who Owns the KPI Determines What It Measures. When KPIs are owned by the technology team, they gravitate toward system metrics (uptime, latency, model accuracy). When they are co-owned by operations, they gravitate toward process outcomes: cycle time, error rate, business impact. This single organizational detail predicts, more reliably than the AI tool itself, whether a company’s measurement dashboard will actually answer a CFO’s question or dodge it. Before your next AI rollout, decide explicitly who owns the KPI definition – not just who owns the technology.
Gem 2: There’s an Emerging Metric Built Specifically to Compare AI Approaches — LCOAI. Levelized Cost of AI (LCOAI) is a 2025-emerging metric that calculates the cost per useful AI output across the full model lifecycle; directly analogous to the energy sector’s “Levelized Cost of Electricity.” LCOAI divides the present value of total AI costs (capital plus operating expenses) by the present value of total useful output, helping compare API-based generative AI versus in-house deployments on equal footing. For a business weighing whether to expand from one AI tool to several, or deciding between vendors, LCOAI is a more honest comparison than sticker price alone.
Gem 3: The Monitoring Gap Between Companies Is Larger Than the AI Gap. Organizations show dramatic variation in AI output oversight, from reviewing all AI-generated content before it’s used, to almost no monitoring at all. This gap in monitoring discipline is frequently larger than the gap in AI capability between organizations, meaning two companies using the identical AI tool can produce wildly different results purely based on how rigorously they review and correct its output. Error rate, tracked consistently, is what turns an unmonitored AI deployment into a governed one.
Gem 4: Case-Specific Metrics Beat Universal Metrics Every Time. A telecom firm measuring an AI chatbot doesn’t just track chatbot accuracy in isolation; it tracks the percentage of queries resolved without escalation to a human agent, because that number ties directly to labor cost and customer experience in a way raw accuracy never can. This pattern generalizes: the most valuable KPI for any specific AI use case is rarely a generic industry metric — it’s the one metric that most directly connects that specific workflow to a cost the business already tracks. Before adopting someone else’s KPI list wholesale, ask what your business already measures that this AI tool touches, and build the metric from there.
Gem 5: Reporting Early-Stage Metrics Is a Credibility Strategy, Not a Consolation Prize. Business outcome metrics require more time to accumulate than adoption or cycle time data — which means an early-stage AI program genuinely cannot produce a defensible dollar figure in month one, no matter how well it’s going. Reporting adoption and override rate data in early quarters demonstrates measurement rigor and sets a clear trajectory, even before business outcome metrics are statistically significant. Teams that try to force a premature ROI number in month one, rather than reporting the honest earlier-stage metrics, consistently lose more credibility than teams that say “here’s what we’re tracking now, and here’s when the outcome number becomes reliable.”
Bottom Line: Answer the Question Before It’s Asked
The professional services firm in this article’s opening case study didn’t fail because their AI wasn’t working. They nearly lost budget confidence because their dashboard couldn’t answer the one question that actually mattered, and by the time the CFO asked it in the room, it was too late to have a good answer ready.
The businesses winning the AI measurement conversation aren’t the ones with the fanciest dashboards.
They’re the ones who can answer “what did we get for the money” in one sentence, backed by a number nobody in the room can dispute.
56% of CEOs report zero AI ROI. Companies that revise their KPIs alongside AI adoption are three times more likely to see real financial benefit. The gap between those two facts isn’t luck, budget size, or which AI vendor you chose. It’s whether you built the measurement infrastructure before you needed to defend the investment, or after.
MediaBus Marketing Group helps businesses build exactly that measurement infrastructure
The right KPIs, in the right sequence, tied to the business outcomes that actually justify continued investment.
📞 · Contact Us Down Below · 🌐
Build your AI measurement framework before your next board meeting — not after.
First AI KPIs FAQs
Q1: What’s the single most important AI KPI for a small business just getting started?
Adoption rate. Early-stage AI programs, in their first 90 days of production, should focus on adoption rate as their primary KPI: what percentage of the eligible workflow or eligible team is actually using the tool regularly, not just logged in once out of curiosity. This matters more than any accuracy or ROI metric in the earliest stage because it’s the leading indicator of whether the tool will ever generate downstream value at all. A brilliant AI tool that nobody actually incorporates into daily work will never show up in a business outcome number, no matter how capable it is. Pair adoption rate with human override rate (how often people reject the AI’s output) to get an early read on whether the tool is earning genuine trust, not just technical usage.
Q2: How long does it take before we can measure real business outcome from an AI investment?
Business outcome metrics require more time to accumulate than adoption or cycle time data; typically the second full quarter of use, not the first 90 days. This is not a sign that something is wrong; it’s the normal sequence of AI measurement maturity. Cycle time reduction is usually visible within 30-60 days. Error rate and human override rate stabilize into meaningful trends by day 60-90. Business outcome – the specific dollar, hour, or conversion impact attributed to the AI initiative – typically requires a full quarter of stable adoption before the number is statistically credible enough to defend in a board meeting. Reporting the earlier-stage metrics honestly in the meantime is what demonstrates measurement rigor and buys the patience needed to reach the outcome number.
Q3: Why do login counts and license utilization make such misleading AI KPIs?
Most enterprises measure AI adoption by counting licenses or logins, and neither metric tells a board whether AI is delivering business value. A login only confirms someone opened the tool once; it says nothing about whether they used it in a way that changed an outcome, whether the output was good enough to use without heavy correction, or whether it saved any actual time. High login counts with low quality improvement is one of the most common false-positive patterns in AI reporting: the dashboard looks healthy while the business impact is genuinely unclear. MIT’s Project NANDA research found that 95% of enterprise generative AI pilots deliver zero measurable P&L impact, and many of those pilots show perfectly healthy adoption dashboards right up until someone asks what the business actually got for the money. The fix is tracking metrics tied to process outcomes (cycle time, error rate, business impact) rather than platform activity.
Q4: Should every department or team use the same AI KPIs?
No – one of the four core reasons organizations struggle with AI measurement is applying a one-size-fits-all approach across teams with genuinely different use cases. A customer service AI should be measured on metrics like percentage of queries resolved without human escalation and response time. A sales-support AI should be measured on qualification accuracy and time-to-decision on a lead. A document-drafting AI, like the one in this article’s case study, should be measured on cycle time and revision rate. The 6-metric framework in this article (cycle time, adoption, error rate, override rate, time-to-decision, and business outcome) provides the universal categories, but the specific metric within each category should be built from what your business already tracks for that function, not copied wholesale from a generic industry list.
Q5: How do we present AI KPIs to a board or leadership team that isn’t technical?
Translate the six operational metrics into the four ROI pillars a board actually speaks: efficiency gains (lower costs, reduced manual hours), revenue generation (improved conversions, new revenue streams), risk mitigation (fraud prevention, compliance improvements), and innovation capacity (new capabilities the business can now offer). A non-technical leadership audience doesn’t need to hear “our override rate dropped 12 points” – they need to hear “our proposal drafting time dropped from 3.2 hours to 51 minutes, which redirected roughly 40 partner-hours per month toward new client acquisition.” Lead every report with the business outcome number when you have one; use the operational metrics as supporting evidence for how you got there, and be explicit and honest in early quarters that business outcome data is still accumulating.
Action Items:
SHARE THIS STORY ANYWHERE YOU LIKE
SHARE THIS STORY ANYWHERE

How Can AI Help Us Capture More Business and Handle More Work Without Immediately Hiring More People?
How Can AI Help Us Capture More Business and Handle More Work Without Immediately Hiring More People? The [...]

Setting Realistic Goals for AI Implementation
Setting Realistic Goals for AI Implementation The SMART Framework, the Achievability Trap, and Two Verified Real-World Examples of [...]
What KPIs Should I Actually Track?
What AI KPIs Should I Actually Track? The 6-Metric Framework That Separates Proof from Guesswork What You'll Find [...]